

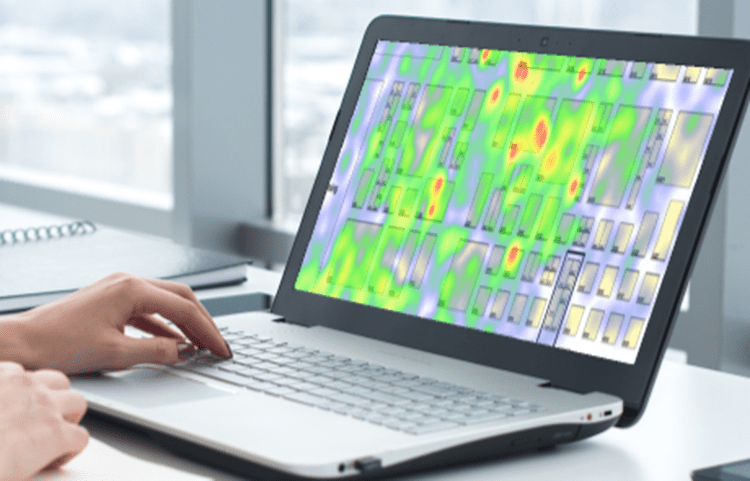
Seeing traffic flow in real-time through heat-mapping can allow for timely adjustments and post-event analysis, thus increasing the meeting ROI.
Heat-mapping helps associations tackle a variety of problems and can help increase meeting ROI, said Silke Fleischer, CEO, Ativ Software. “Event planners can, in real-time, detect hot spots or unexpected low attendee traffic areas in the expo hall and set up interventions to make changes on the fly.
“These could include a strategically placed coffee cart or taking advantage of gamification to drive traffic,” she said. Plus, using past heat-map data, event planners can prepare their exhibitors for when to expect peak times so they can staff their booths appropriately.
Diedra Crawford, CEM-AP, CMP, industry sales and operations director, Digestive Disease Week (DDW), has been using heat-mapping since 2016.
Crawford said DDW was already using ATIV’s medical meetings app EventPilot to help their 14,000 attendees navigate the annual meeting and decided to try heat-mapping (“less expensive than RFID and more timely than Wi-Fi-enable tracking”) to see what effect moving their poster area would have on the overall traffic flow of the trade show floor. “Many exhibitors had resisted being situated near the poster hall until data revealed that the traffic near the posters was actually higher.”
Shannon Rosenberg, senior director, ethnoMetrics, by Globel Experience Specialists (GES), said that by quantitatively identifying the traffic distribution across their floor, heat-mapping can help associations determine how best to layout the exhibit floor to maximize distribution. “Some may also use it to implement variable pricing – charging exhibitors more to be in the ‘hottest’ (most visited) zones on the floor.”
Real-Time Data
Heat-mapping also provides actionable real-time data, Crawford said. For example, seeing the main entrance was busier than expected; the team quickly opened an additional entry area and increased security staffing.
Crawford said that heat-mapping data can be paired with exhibitor activities and lead retrieval numbers to better counsel exhibitors on preshow marketing and in-booth activities to increase their traffic.
Key Learnings
Industry experts advise having a clear goal on what questions the data should answer before embarking on heat-mapping.
It’s easy to “get swept up in the ‘coolness’ of the data…but cool-looking data doesn’t necessarily translate to actionable items,” warned Fleischer.
“Work with your vendor and have them assist with the post-event data analysis,” Crawford advised.
Crawford also advised users to proactively alert exhibitors that they might see heat-mapping beacons in their booths or on the pipe and drape. “We provided preshow flyers to explain what the beacons do and what to if any fell off,” Crawford said.
Because heat-maps entail location tracking, privacy can be an issue. “Organizers need to clearly communicate in advance if personal locations will be tracked, how attendees can opt-out, and how the data will be used or shared,” said Fleischer. To promote acceptance, she recommends using a service that not only tracks attendees but offers them functionality like indoor positioning and routing to help attendees navigate from one booth or research poster to another, “like Google maps but indoors where GPS doesn’t work.”
On the Horizon
Crawford said she is also considering offering a program that does heat-mapping in small areas as an additional service to exhibitors who are interested in more detailed data about traffic within their booth.
YOU MIGHT ALSO BE INTERESTED IN:
Turning Big Data into Actionable Insights
Cutting Through the Hype of Strategic Meetings Management & Big Data

